AVOXI Alerts help users to be proactive on the status and performance of their numbers. Monitor anomalies, resolve configuration issues, and maintain satisfactory call experiences by creating alerts on the metrics that matter the most to you. Users will receive alert notifications via the methods of their choosing.
Notification Settings
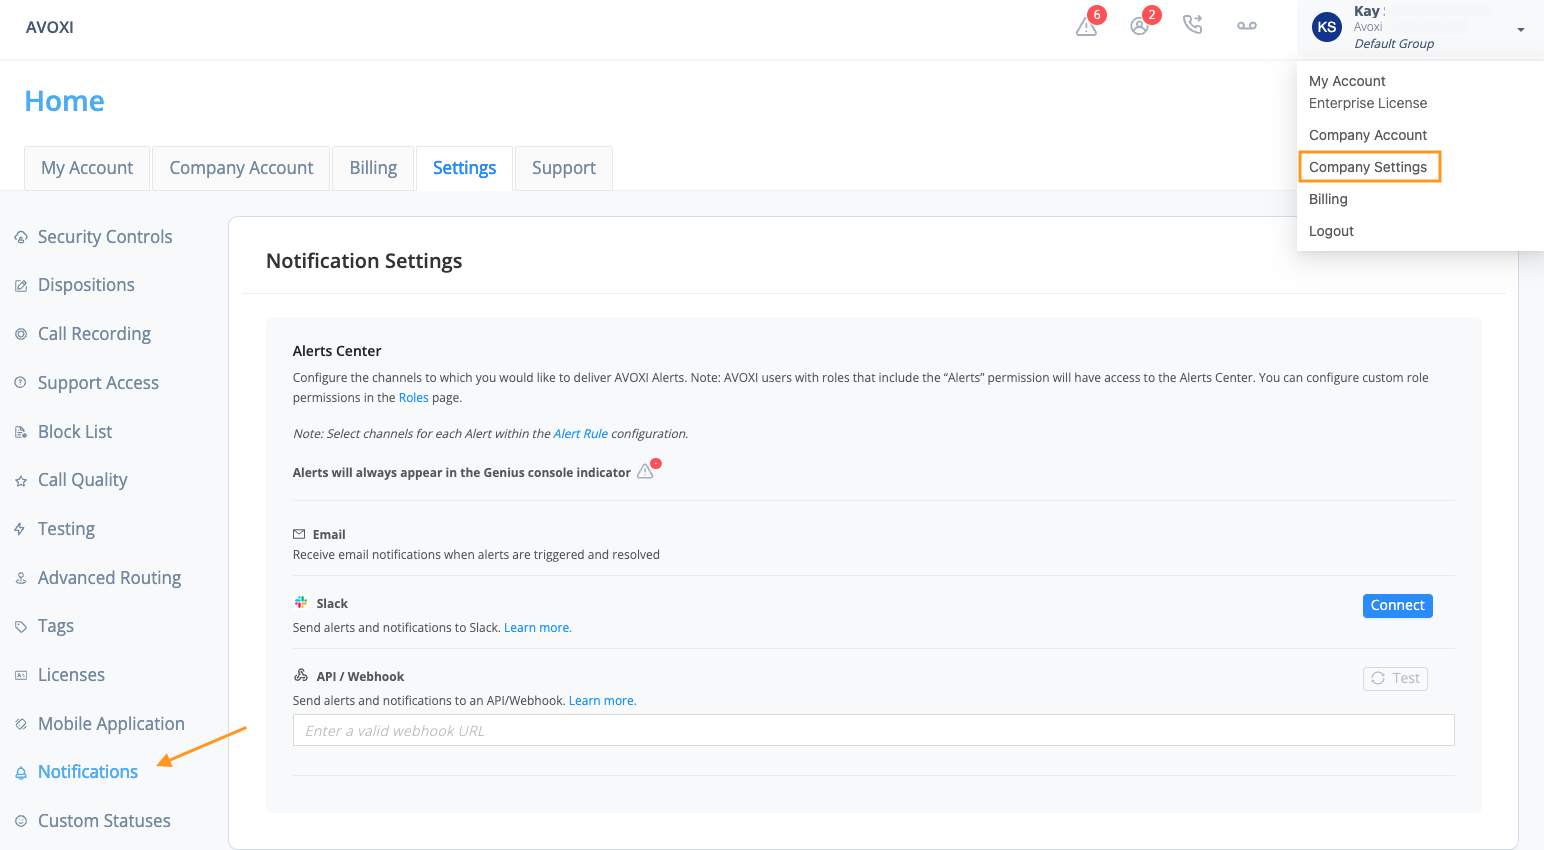
Users can receive alert notifications within the Genius console or via email, Slack, or Webhooks. Console notifications will always be enabled by default.
To manage your notification methods:
- Navigate to Company Settings
- Select Notifications from the left menu
- Configure your desired notification methods
- Genius console — always enabled by default
- Email — always enabled, configure recipients within the alert rule
- Slack
- Connect to Slack workspace
- Select the channels and users you wish to allow messages to be delivered to
- Once connected, use the ‘Manage’ button to add/remove channels and users, or disconnect integration.
- Alert recipients are configured within the alert rule
- Webhook
- Enter the endpoint you wish to deliver alerts to.
- Use the ‘Test’ button to test the connection.
Console Notifications
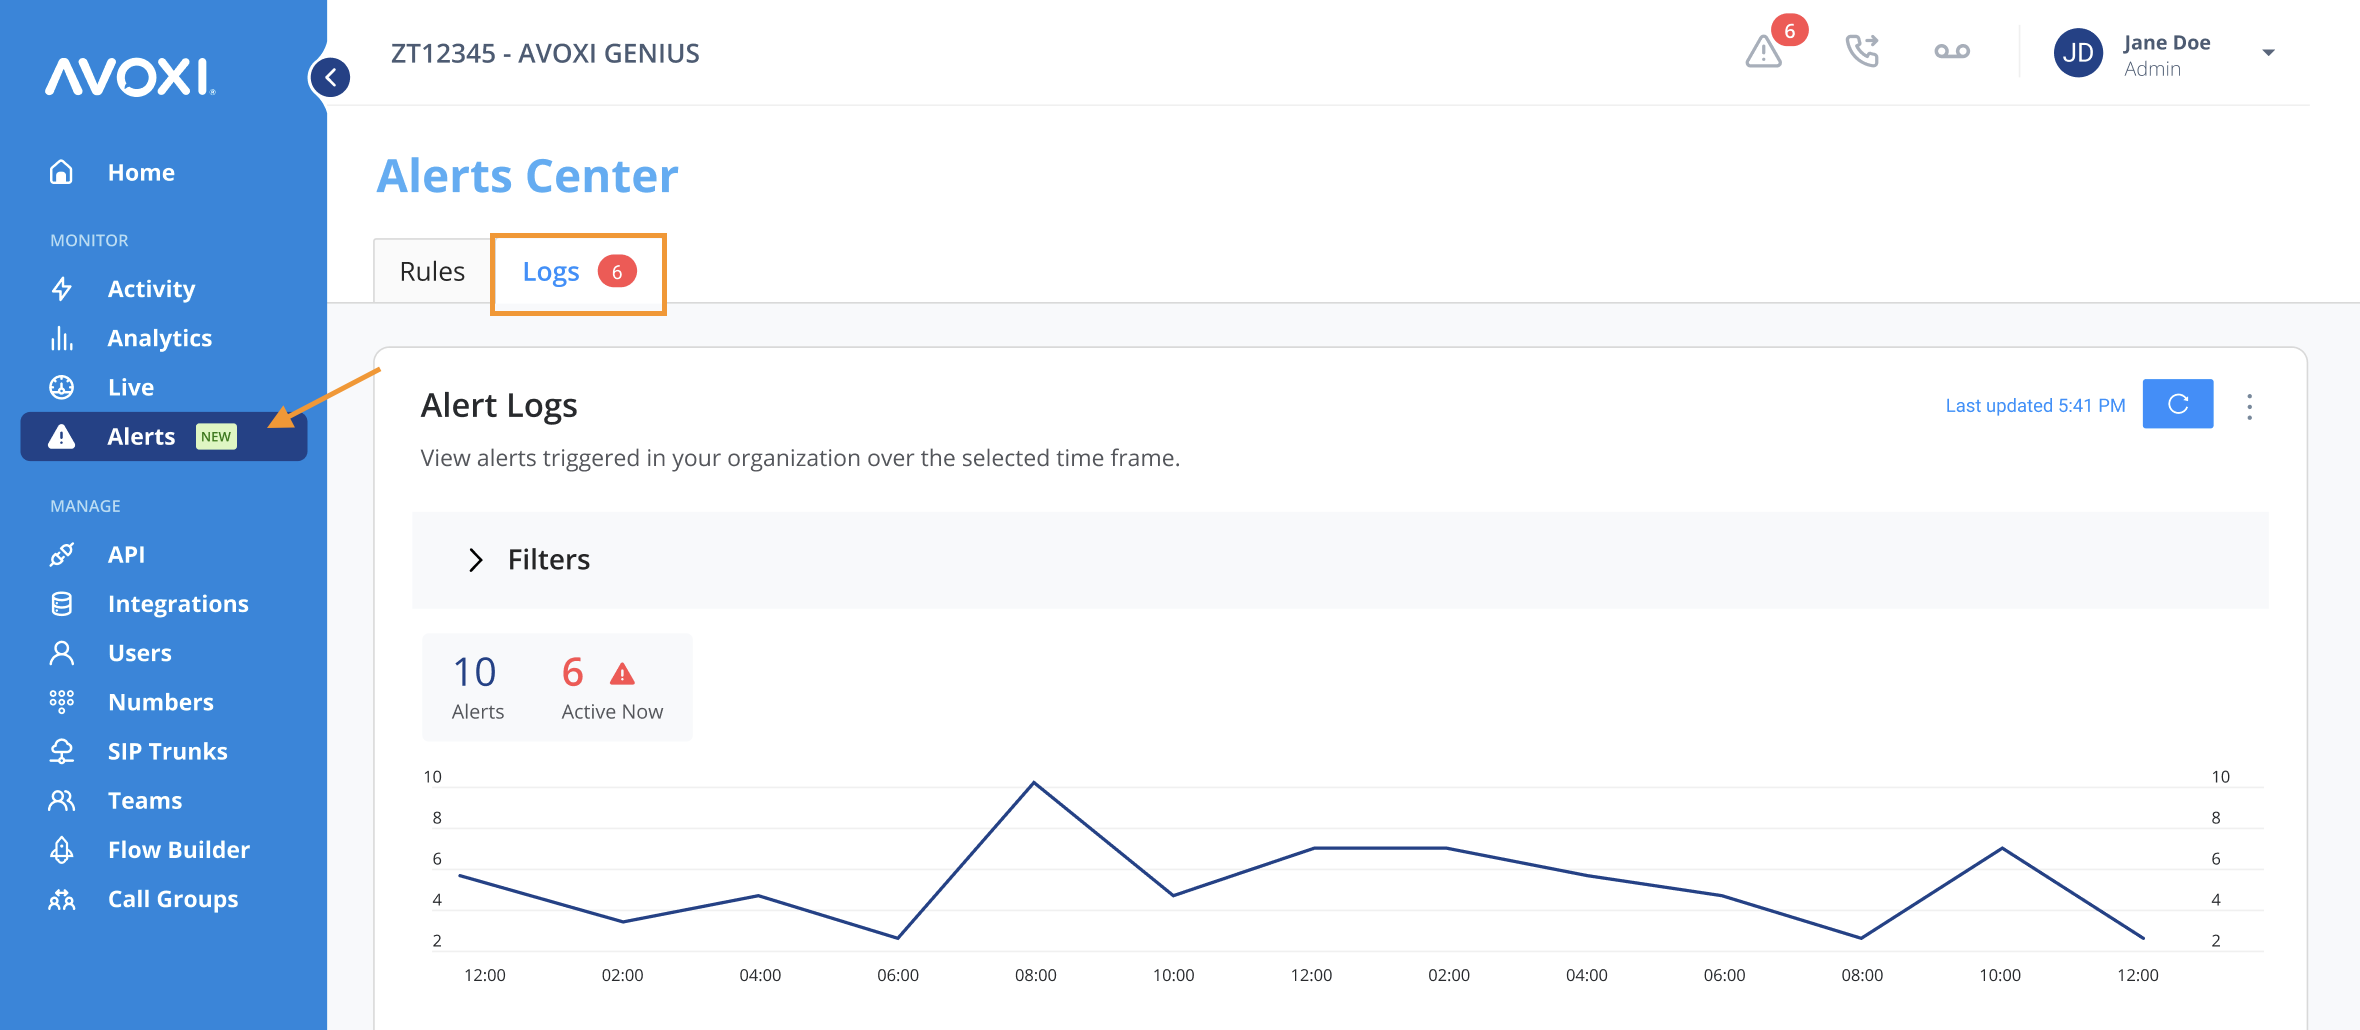
When logged into the AVOXI Genius platform users will see an alert icon in the top navigation bar. This icon will indicate the number of triggered alerts that are currently in an active state. Clicking on the alert icon will take the user to the Alert Logs page where they can view the history of triggered alerts.

Alert Logs
Within the Alerts Center, users can navigate to the Alert Logs page to view the history of triggered alerts. The top of the log will show a count of total alerts that have been triggered as well as a count of currently active alerts. A line graph appears at the top of the log indicating the number of alert occurrences over the past 24 hours. The table displays relevant alert details. Users can select an alert to view additional alert details.
Accessing the Alert Logs
- Select Alerts from the left-hand navigation menu
- Select the Logs tab
- Use the filters to view specific alerts
- Date Range - Choose the date range for when the alerts were triggered
- Alert Triggered - Choose an alert rule
- Number - View alerts for a particular number
-
Alert Status - Select an alert status
- Active - Indicates an alert that is still triggering the configured threshold as of the last alert check.
- Deleted - Indicates an alert whose alert rule has been deleted. This alert is considered resolved.
- Disabled - Indicates an alert whose alert rule has been disabled. This alert is considered resolved.
- Resolved - Indicates an alert that is no longer triggering the configured threshold.
Viewing your Alert Logs
The Alert Logs graph displays the count of alerts over time during the selected date range.
- Alerts – Count of alerts based on the selected date range and filters
- Active Now – Count of currently active alerts regardless of the selected filters
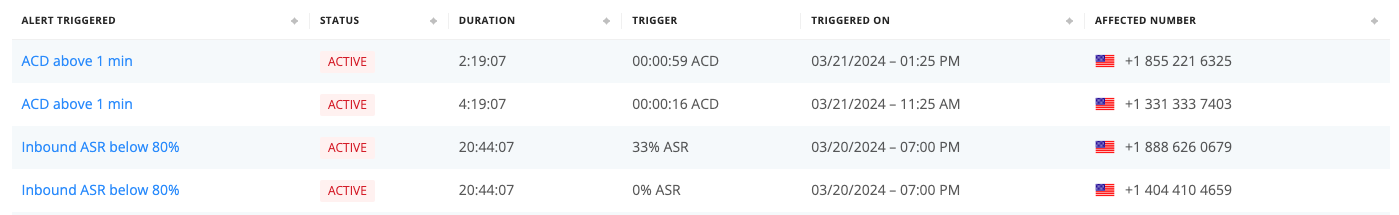
The Alert Logs table shows a history of triggered alerts. Filters can be used to focus on particular alerts. The table displays relevant alert details. Users can select an alert to view additional alert details. Active alerts will appear at the top of the alert log.
- Alert Triggered - The name of the alert that was triggered
-
Status - The status of the alert
- Active - Indicates an alert that is still triggering the configured threshold as of the last alert check.
- Deleted - Indicates an alert whose alert rule has been deleted. This alert is considered resolved.
- Disabled - Indicates an alert whose alert rule has been disabled. This alert is considered resolved.
- Resolved - Indicates an alert that is no longer triggering the configured threshold.
- Duration - How long the alert has been active or how long it was in an active state
- Trigger - The value that caused the alert to trigger. For example, you may have set your alert to notify if a number falls below 80% ASR, however, when the alert check ran this particular number triggered the alert at 70%.
- Triggered On - The date and time when the alert was initially triggered
- Affected Number - The phone number that triggered the alert
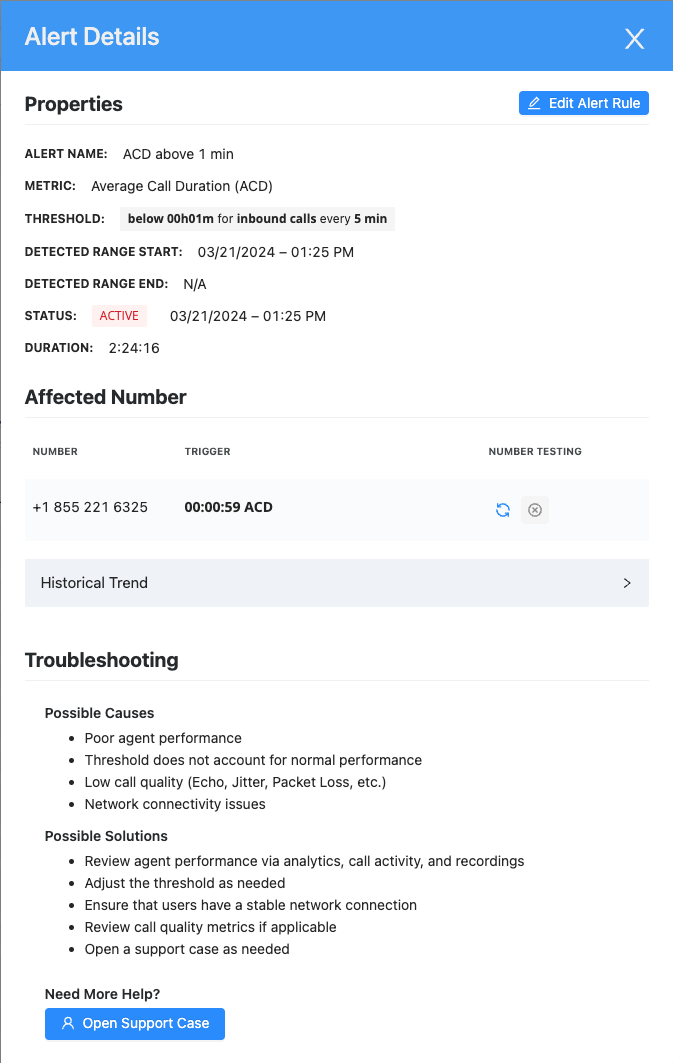
Alert Details
View additional alert details by selecting an alert from the Alert Logs list.
- Alert Name - The name of the alert that was triggered
- Metric - The metric that the alert is tracking
- Threshold - The configured threshold that the alert rule is checking for
- Detected Range Start - The date and time that the alert was triggered
- Detected Range End - The date and time that an alert was resolved or made inactive
- Status - The status of an alert (Active, Deleted, Disabled, Resolved)
- Duration - For active alerts, this shows how long the alert has been in an active state. For resolved or inactive alerts, this shows how long the alert was in an active state.
- Number - The phone number that triggered the alert
- Trigger - The value that caused the alert to trigger. For example, you may have set your alert to notify if a number falls below 80% ASR, however, when the alert check ran this particular number triggered the alert at 70%.
- Historical Trend - Graph displaying alert occurrences for this number
- Troubleshooting - Possible causes and solutions to help investigate and resolve the alert.